HawkFlow.ai UI pages components
Reports - Notifications page
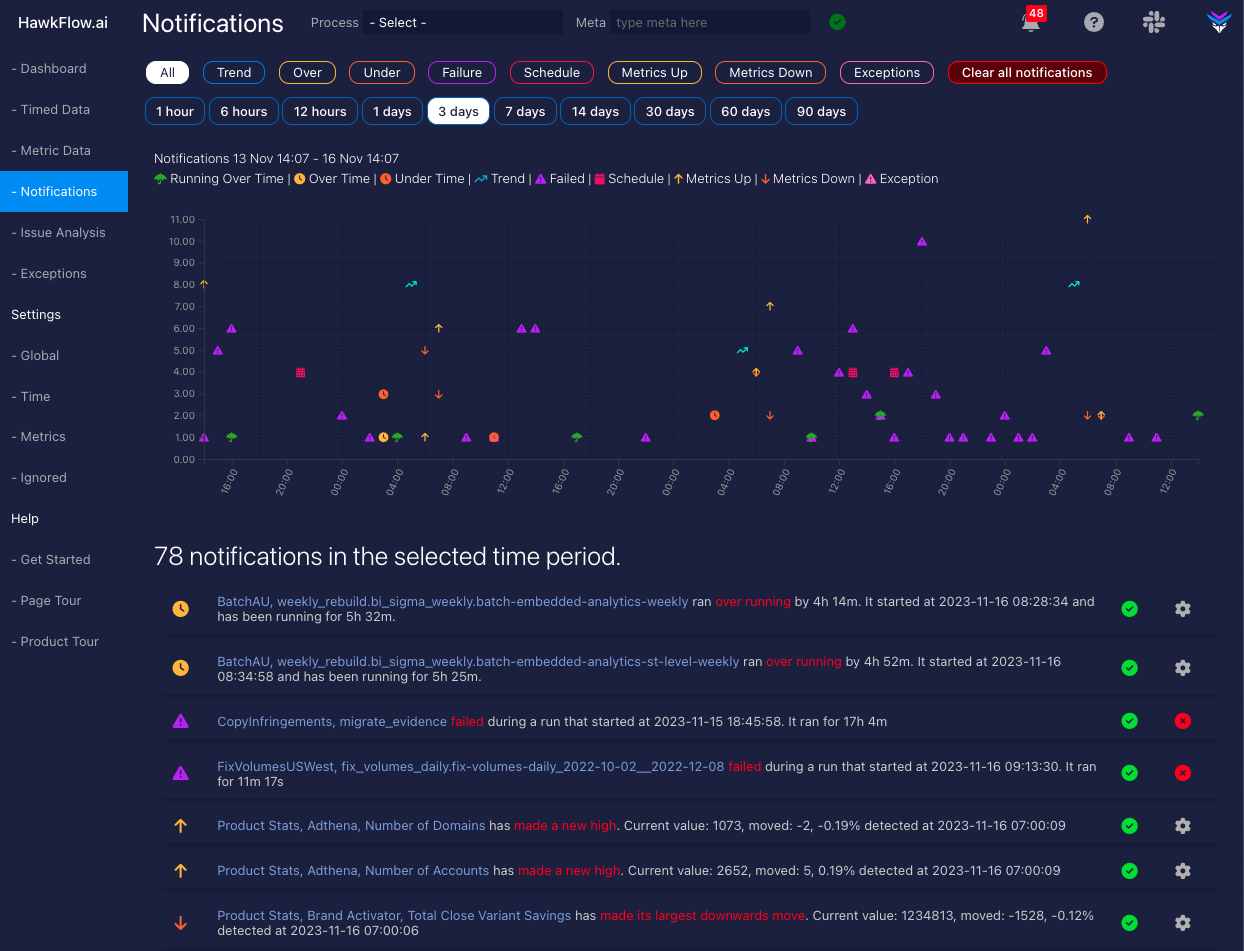
The notifications page is where you will find all the issues that HawkFlow has detected in your system. These can be:

- A process is trending up or down with regards to how long it takes to run over weeks or months
- A processes individual run is longer or shorter than expected
- A process that runs on a schedule has not run
- A process has failed while running
- A numerical value that you send in has made a new high or low or is trending up or down
When you click a notification it will take you to the data and show you information about the alert.
Notifications chart
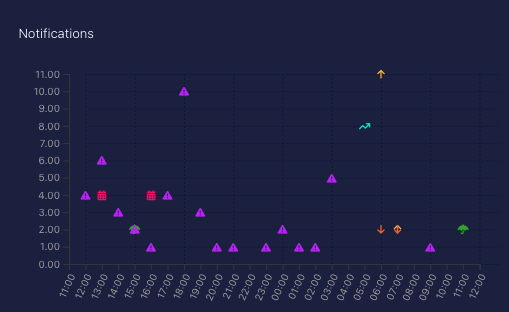
The daily issues chart shows you number of issues your processes are having each day. As with other charts, the orange bars represent a process running faster than normal. A yellow bar represents a process running slower than normal, a failed process is represented in purple, and exceptions are in pink.
Notifications Table
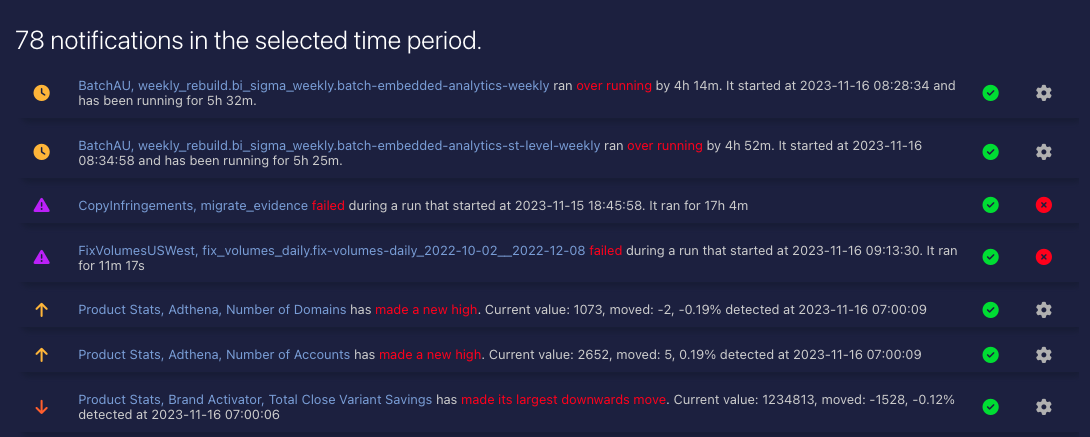
The notifications table is where you can find all your past and present notifications. There are several different types of notification that you receive.
Notifications Table Actions
Ignore notification

Clicking ignore notification means that this type of notification for this process / meta combination will not be raised again. You can change this back in the ignored settings part of the application.
Acknowledge notification

Clicking acknowledge notification will let the system know that you have seen this notification and would like to remove it from the list.
Notification settings

Some notifications cannot be ignored, but you can increase the thresholds that trigger the notifications in the settings part of the app. There you will be able to either fine tune the thresholds or make them so large that the notification will never be raised again.
Notifications Categories
Trends

You will see the trend icon if a trend is detected in either your your processes or your metrics. Trends are when the processing time or a metric value is increasing slowly up or down over time.
Schedule

You will see the schedule icon if a process or metric has missed their schedule as described above in the missing processes section.
Processing Time

You will see the time icon if a processes is detected to be running faster or slower than its normal running time.
Metrics

You will see the arrow metrics icon if a metric is making new highs / lows or largest ever movements.
Failures

You will see the failure icon if a process failure is detected. A failure is when a processes starts, then without ending, starts again. HawkFLow.ai will detect the first run has failed as it did not end.